Northwest Arkansas Commercial Real Estate Statistics Investors Should Track
Cap rates, vacancy, rent PSF and absorption across Bentonville, Rogers, Fayetteville and Springdale. The commercial numbers investors need for I-49 deals.

Most write-ups on Northwest Arkansas real estate lean on the residential story: median prices, days on market, the Walmart supplier flywheel. Useful, but it does not underwrite a shopping center in Rogers or a flex building off I-49. Commercial deals move on different data — vacancy by asset class, rent per square foot, absorption, deliveries, cap-rate spreads to the risk-free rate — and the two big regional data sources (the Arvest Skyline Report and Sage Partners' quarterly summaries) do not always agree because they measure different property sets.
What follows is the scoreboard an operator should keep open when pricing a deal in Benton or Washington County in 2026. Every figure is linked to the report that published it, because the point of a scoreboard is that you can go check the box score yourself.
Start With the Overall Vacancy Print
The headline number in NWA commercial is the Skyline Report's overall leasable-space vacancy rate, published twice a year by the Center for Business and Economic Research at the Walton College. In the first half of 2026, that rate ticked up to 7.6% from 7.2% a year earlier after more than a million square feet of new space opened. That is the loosest the market has been in several years, but it is still inside the 5%–10% band the report's authors treat as healthy.
The other tell is building permit velocity. Commercial permits totaled roughly $144.5 million in the first half of 2026, down about 50% year over year, and the prior period ($140.4 million) was the lowest permit total since the first half of 2017. Translation: the wave of Walmart-adjacent construction that defined 2022–2024 is unwinding, and new supply in 2027 will be thinner than most brokers acknowledge. If you are underwriting a 2027 lease-up on a spec building, that matters.
Office Is Still One of the Tightest Markets in the Country
National office is in a well-documented mess. NWA is not. Sage Partners' mid-year 2026 summary put regional office vacancy at 5.3%, up 1.3 points off a record low but still one of the tightest office markets in the country. For context, national office vacancy is running above 20%. The Q1 2026 asking rent was $27.03 per square foot, and brokers were reporting new-lease trades in the $33–$37 range on quality Bentonville and Pinnacle Hills space.
The Skyline Report, which pulls in more Class B and owner-occupied conversions, will always show higher office vacancy than Sage — the two panels are measuring different universes. Use both. Sage tells you what an institutional Class A tenant is paying; Skyline tells you what happens when a national tenant vacates a mid-block Fayetteville building and it hits the leasing market at once.
Two operating notes for anyone underwriting office here. First, most of the roughly 250,000 SF of office under construction at midyear was preleased, per Sage, so 2026 deliveries do not threaten in-place rents. Second, the shift away from full-service gross to triple-net or modified-gross structures — driven by insurance and property tax pass-throughs — means your rent PSF comparisons across vintages need a lease-structure adjustment before they mean anything.
Industrial: Two Reports, Two Numbers, One Market
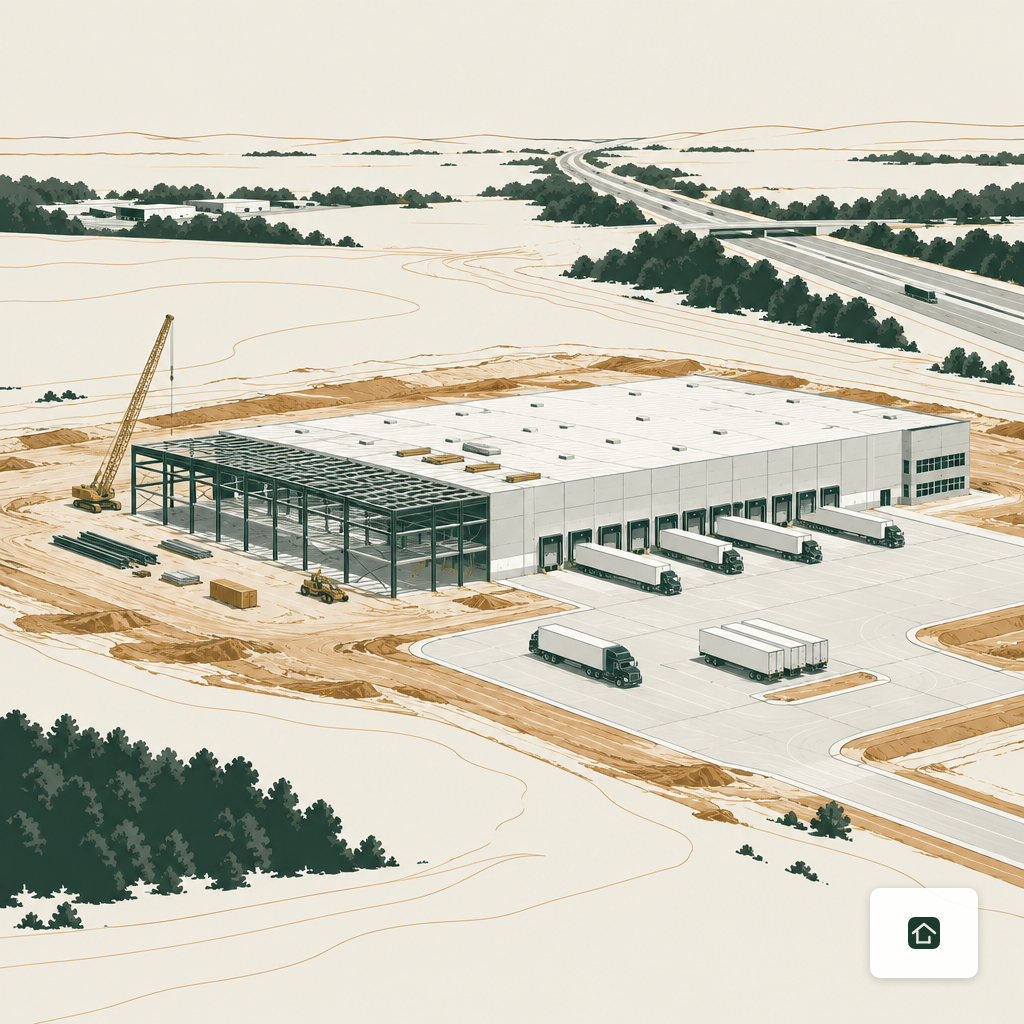
Industrial is where the two data sources diverge most sharply, and where investors get confused. Sage's mid-year 2026 read had industrial vacancy at 5.2% versus 7.5% nationally, with trailing twelve-month net absorption of 1.4 million square feet and market rents at $9.80 per square foot. The Skyline Report's first-half 2026 read had industrial vacancy at 9.7%, up from 6.1% in the second half of 2025.
Both are correct. Sage's panel is weighted toward modern bulk distribution product; Skyline's captures a broader base including older, smaller flex and warehouse. When a single 300,000-SF vacancy hits Skyline's smaller denominator, the rate jumps. Cushman/Sage's Stephanie Farmer has called the underlying market extremely steady, and the Skyline authors themselves noted that the warehouse subsegment can look more volatile than the fundamentals.
What we underwrite: bulk distribution above 50,000 SF, near XNA and along the I-49 corridor from south Bentonville through Springdale, is priced tight. If you are chasing a small-bay flex deal in an older Springdale park, price it to Skyline's number, not Sage's — that is your realistic re-tenanting window. The mechanics of that build-versus-buy calculation for income property are broken down further in our piece on building vs buying multi-family, and the same logic applies to small industrial.
Retail Absorption Is the Sleeper Story
NWA retail is quietly the tightest segment of the four. Sage's mid-year 2026 report put retail vacancy at 3.5%, below the 4.4% national average, up marginally from 3.3% at Q1. The Skyline Report's own retail read for the second half of 2025 had retail vacancy at 6.0%, down from 6.6% earlier in the year. Either way, well-located retail is leasing quickly and speculative retail construction has stayed disciplined.
Fayetteville retail absorption is being driven by two forces that have nothing to do with each other: continued University of Arkansas enrollment growth (the demand-side story we walked through in our post on student housing near the U of A) and the buildout of secondary trade areas in Farmington and west Fayetteville as new-home construction pushes the rooftop map outward. In Bentonville and Rogers, retail demand is downstream of Walmart supplier headcount and the tourist economy around Crystal Bridges and the Momentary.
Multifamily Loosened Faster Than the Rest
The story that will show up in every 2026 pitch deck: multifamily vacancy in NWA nearly doubled to 7.3% from 3.7% a year earlier as 21 new complexes added 3,202 apartments, most in the first half of 2026. Average listed rent was $1,145.01 per month, up 4.7% year over year, but the Skyline Report cautions that headline rents overstate what tenants actually pay because operators are granting case-by-case concessions to hit lease-up targets.
For syndicators, that means two things. Trust the effective rent, not the pro forma. And expect the concession environment to persist for two to three lease cycles at newer Class A properties before the pipeline slows enough to burn off. The permit data supports that: multifamily permits topped $1.06 billion in 2025, so deliveries roll through most of 2026 and into 2027.
Deliveries and the Sewer Constraint
Any 2027–2028 supply model needs to price in NWA's infrastructure bottleneck. Skyline researchers have flagged sewer capacity limitations in Bentonville, Centerton, Decatur, Elkins, Farmington and Rogers, warning that census population projections cannot be supported by current infrastructure. Panelists surveyed for the report expect slower growth in 2026 and 2027 tied to those sewer issues, followed by re-acceleration.
That timing matters for entitlement work. Land tied up today in a jurisdiction with a sewer moratorium is a different asset than land in one with capacity, and the delta shows up in your carry cost, not your purchase price. Investors sourcing sites should read our note on raw land and lots in Northwest Arkansas alongside the Skyline commentary.
Cap Rates: A Directional Market, Not a Print
NWA does not have the transaction depth of a top-25 metro, so published cap rates are directional rather than authoritative. Third-party analysis anchors industrial to leasing fundamentals rather than a deep sale-comp series given how thin institutional trade volume is here. What we see in practice: stabilized Class A office and modern bulk industrial trading with the tightest spreads to national comps, older neighborhood retail trading at a discount that reflects tenant credit rather than location, and multifamily cap rates widening slightly on 2020–2023 vintage deliveries as concessions compress in-place NOI.
Underwriters new to the market should not assume that a headline cap rate from CoStar or a broker OM reflects a real closed trade. Ask what closed, when, and to whom. Then compare it against the current lease-up on comparable product. Anyone building a Bentonville, Rogers or Fayetteville pro forma should also pull down the operating expense picture from our commercial property management team before signing.
What This Scoreboard Actually Tells You
Read the four asset classes together and the 2026 NWA market has a clear shape. Office is protected by a corporate ecosystem the rest of the country does not have. Industrial is fundamentally tight but statistically noisy; do not react to a single Skyline print. Retail is the segment with the least new supply and the most pricing power. Multifamily is working through a delivery wave that is real but finite, and concessions are the temporary tell.
None of that says "buy anything." It says price the deal against the segment fundamentals, not the regional narrative, and reconcile the two data sources rather than picking the flattering one. When those numbers point the same direction, the underwriting gets easier. When they diverge — as they did on industrial this year — that is where the operator's edge lives.
Christine M writes about Northwest Arkansas real estate and investment for Estate.co.
More from Christine M


Thinking about investing in Northwest Arkansas?
Talk through your goals with an operator who has closed in this market for two decades.